
Forecasting is inherently tricky. Everyone’s coming up with numbers based on different data. It’s no wonder projections are so hard to trust. That’s why predictive revenue modelling is becoming more important. The pressure on the forecast is getting heavier at the exact moment the data foundation is getting more complicated.
Salesforce says most companies are juggling multiple tools, and a big chunk of the data they need to “predict the future” is still in accessible. All the while, leaders are expected to make sharper calls on hiring, spend, and growth with less tolerance for “we’ll know by the end of the quarter.”
Predictive revenue modelling with AI doesn’t guarantee a clear view of “what’s going to happen next”, but it does give companies a way to turn fragmented signals into something more operational.
Further Reading:
- Sales Automation and Productivity
- The 5 Superpowers of AI Copilots for Sales
- Sales Automation and AI Tools
What is Predictive Revenue Modelling?
Predictive revenue modelling is a way of turning messy commercial reality into a forecast you can explain clearly. It uses what’s already happened (wins, losses, slips, renewals that got saved at the last minute) plus what’s happening right now (deal movement, buyer engagement, pricing friction) to produce enterprise revenue analytics that answer two questions leaders actually care about:
- What’s likely to land, and when?
- What changed since last week, and why?
For most companies, predictive revenue modelling solutions don’t rely on a single tool. You need a small system that combines:
- Clean inputs (where truth starts). CRM fields that mean the same thing across teams. Close dates that aren’t wishful thinking. Pricing and approval signals that aren’t trapped in Slack.
- A prediction model: A system that can score the likelihood of specific outcomes, spot slippage patterns, and update as deals change.
- The explanation layer. A revenue intelligence platform should do more than display pipeline. It should tell you what’s fragile, what’s stuck, and what’s driving the number, like discounting, stalled stakeholders, slow legal cycles, whatever is actually happening.
How Does AI Improve Sales Forecasting?
Predictive revenue modelling doesn’t improve forecasting because AI is faster at producing spreadsheets. What makes it helpful is how it sees patterns most people would probably miss, and it sees those patterns early. When a system has access to the right data and tools:
- It picks up non-linear patterns across messy data, including behavior shifts, pricing friction, and outside variables that humans rarely model well.
- It updates forecasts in real time as new signals arrive, which matters because stale forecasts are fake forecasts.
- It improves pipeline decisions, not just forecast math, by spotting which opportunities are gaining momentum and which ones are quietly dying.
- It cuts a lot of human bias out of the process. Reps are human. Managers are human. Quarter-end optimism is very human. AI is useful because it’s less sentimental.
Studies have already shown that AI-driven forecasting can improve accuracy by 20-30% compared to traditional methods. Insights like that are backed by real-world case studies, too. Look at Upwork’s RevOps team, they improved sales forecasting accuracy to 95% with Gong’s AI tools.
Plus, AI helps with operational efficiency around the forecast itself. It can automate parts of data prep, flag anomalies the minute they appear, and support more granular planning. In some environments, that means tighter staffing or inventory decisions. In revenue teams, it usually means fewer ugly surprises and fewer arguments.
Discover:
- The Ultimate Guide to Sales Enablement Technology
- AI RevOps and AI Revenue Teams
- Unified Customer Experience, Sales, Marketing, and Support
How to Use Predictive Revenue Modelling Tools
It’s easy to assume that all you need to do to bring AI sales forecasting software into your business is choose the right tech. That’s only part of it.
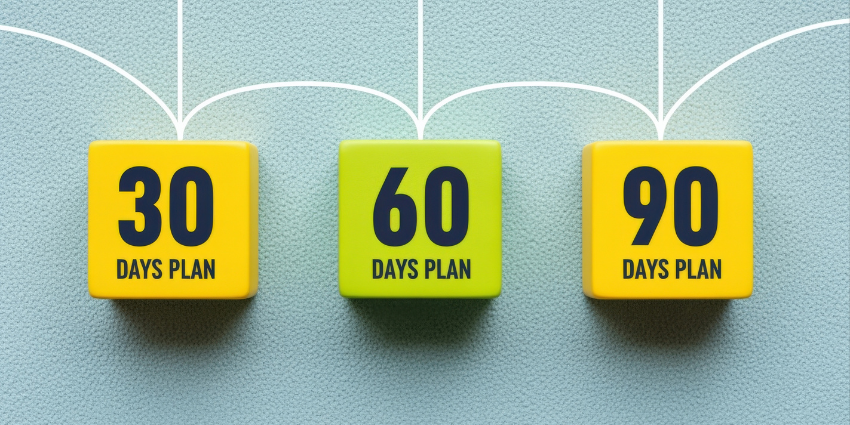
Step 1: Write Your Forecasting “Contract”
Decide how you’re going to be using your forecasting tech in advance. You need to define:
- Forecast horizons: 30/60/90 (pick them, don’t argue weekly)
- Motions: new business vs expansion vs renewal (don’t mash them together)
- Output format: scenarios (base/upside/downside) + confidence + driver notes
- One definition each for: pipeline, commit, best case, upside
- Who’s allowed to override the model output, and what reason they must record
That contract is the backbone of enterprise revenue analytics. Without it, your pipeline forecasting tools will keep producing “accurate” numbers that don’t mean the same thing across teams.
Step 2: Ask: What Data Improves Revenue Accuracy?
You can only trust that your predictive revenue modelling tools are guiding you in the right direction if you know your data is telling the truth. That means connecting, cleaning, and validating your data, before you feed it to a prediction model.
Map all the data you have that can help you predict what’s next in your sales strategy. That means everything from customer feedback, to sales and marketing results.
Make sure you have:
- Opportunity stage rules that mean the same thing across teams (with exit criteria, not vibes)
- Close dates with discipline (date changes tracked, not silently overwritten)
- Amount types separated (one-time vs recurring vs services)
- Product + segment fields that aren’t optional
- Loss reasons that aren’t “went dark” for 80% of deals
- History tracking: stage changes, pushed dates, discount approvals, stakeholder shifts
Then add the signals that actually explain variance:
- Stage aging/velocity (how long deals sit before they rot)
- Pricing friction (discount depth + approval time)
- Engagement quality (meetings held, next steps confirmed, buying committee growth)
Remember, you’re building a clean spine that your pipeline forecasting tools can rely on, and that a revenue intelligence platform can explain without inventing a story.
Step 3: Consider: Which Signals Predict Revenue Risk?
The goal of predictive revenue modelling is really to give you “better” insights that actually explain why deals slip, stall, or surge forward. Start with signals that explain forecast variance:
- Stage velocity + aging: how long deals sit before they rot
- Close date changes: not the final date — the pattern of push-outs
- Pricing friction: discount depth, approval time, deal desk involvement
- Next-step quality: confirmed meetings, mutual action plans, documented stakeholders
- Buying committee movement: new stakeholders appearing late is a red flag, not “interest”
Then, if you’ve got the basics working, layer in “nice-to-have” signals:
- Renewal health (for expansion/renewal forecasts)
- Customer support signals for churn risk
- Community engagement (only if it’s genuinely part of your revenue motion)
Step 4: Tooling and Architecture Decisions
AI sales forecasting software doesn’t fix a broken revenue engine. It sits on top of one, which means it will faithfully amplify whatever mess you feed it.
The cleanest way to pick tooling for predictive revenue modelling is to map choices to the four layers (inputs → prediction → explanation → operating cadence). That’s it. No shopping spree.
- Layer 1: Inputs (capture + consistency): You need a CRM spine plus reliable signal capture (meetings, calls, next steps, pricing approvals). This is where sales automation and copilots earn their keep: they reduce the “I forgot to update the CRM” tax without turning reps into data entry clerks.
- Layer 2: Prediction (the modelling engine): This is your actual AI sales forecasting software. It should handle likelihood and timing, and it should cope with slippage patterns instead of pretending close dates are sacred.
- Layer 3: Explanation (the executive view): A revenue intelligence platform should explain drivers in plain language: which segments widened downside, which deals are fragile, and what changed since last week.
- Layer 4: Operating cadence (governance + adoption): Salesforce found 51% of sales pros said security concerns delayed AI initiatives. That’s not a tech issue; that’s an operating model issue. Permissions, audit trails, override rules, and who owns what.
Step 5: Rollout Slowly and Cautiously
If you roll out predictive revenue modelling like a new CRM, making it a mandatory tool, tied to performance reviews, people will panic. They might use the system, but they’ll still keep their “real” forecast in a separate spreadsheet.
Start in “shadow mode”. That means:
- The model produces forecasts (ranges + confidence + drivers) every week.
- Sales leaders keep running their normal forecast.
- RevOps tracks deltas: where the model is tighter, where humans add context, where each is flat-out wrong.
Use this phrase to calibrate probability thresholds, slippage rules, and override policies before you start scaling.
Step 6: Operationalize It
A working predictive revenue modelling cadence starts with replacing the old forecast call agenda. Instead of “Tell me your number,” you switch to “Here are the deals moving our number, what are we doing about them?” Every week, aim to create three lists:
- Top downside risks (the deals likely to slip or die)
- Top upside levers (where a small action changes the outcome)
- Data/definition exceptions (garbage inputs that threaten trust)
The output should guide clear decisions and trigger actions you can actually test. Just make sure it doesn’t eliminate human judgment. Your forecasts should give you a direction to move in and ideas to explore. Human beings still need to implement their expertise.
Step 7: Measuring the Results
If you measure only “was the forecast right?”, you’ll end up rewarding the wrong behavior. A solid predictive revenue modelling program measures three layers: model quality, revenue impact, and operating impact. That’s the only way to know if the system is actually helping.
Model quality (Is the engine learning reality?)
- Accuracy by horizon: Score the model at 30, 60, and 90 days separately. Don’t let one average number hide the misses.
- Calibration: Check whether the confidence scores mean anything. A 70% call should behave like a 70% call.
- Timing accuracy: Closing eventually is not the same as closing on time. Measure both.
Revenue impact (did it change outcomes, not just reporting?)
- Forecast variance trend: Is your range tightening quarter over quarter?
- Slippage rate: How often do deals push close dates, and how far?
- Pipeline purity: Validated opportunities vs. “created” opportunities
- Cycle time movement: Are deals moving faster because risks surface earlier?
Operating impact (did it make leadership better?)
Look for:
- Fewer last-minute reforecast drills
- More consistent weekly interventions
- Clearer accountability: who owned the risk, who acted, what changed
Using Predictive Revenue Modelling: Forecasts You Can Defend
Predictive revenue modelling can produce serious results, but only if the basics are solid. Most teams are stuck with a messy stack, and AI adoption is moving way faster than governance. That’s why the teams that win consistently didn’t just buy another tool. They built a system and made sure they could trust what it was telling them.
If you’re serious about shrinking forecast variance, don’t start by shopping. Start by deciding what truth looks like, and who owns it. Then pick pipeline forecasting tools, a revenue intelligence platform, and AI sales forecasting software that fit that operating model. That’s enterprise revenue analytics that earns its keep.
If you’re ready to take the next step with AI in your GTM strategy, our ultimate guide to sales and marketing technology is the perfect place to start.
FAQs
What is predictive revenue modelling?
Predictive revenue modelling is a system that uses historical outcomes plus live deal signals to produce probability-weighted forecasts, scenario ranges, and driver explanations you can act on.
How does AI improve sales forecasting?
It upgrades forecasting from “static stage probabilities” to continuous scoring based on real deal behavior, and it surfaces slippage risk early so leaders can intervene while the quarter is still salvageable.
What data improves revenue accuracy?
Clean CRM fundamentals (stages, close dates, amounts, segments) plus signals that explain slippage: stage aging, close-date changes, pricing approvals, discount creep, and next-step quality.
How do enterprises reduce forecast variance?
They split likelihood from timing, model slippage directly, lock down one set of definitions, run shadow mode before rollout, and turn the weekly forecast into a risk review with clear actions.
What tools support predictive revenue analytics?
Usually, it’s a mix: pipeline forecasting tools to keep the pipeline clean and usable, AI sales forecasting software to score likelihood and timing, enterprise revenue analytics to create one version of the truth, and a revenue intelligence platform to show what’s driving the number and what needs action next.